Javascript for Data Analytics
Discover how to harness the full potential of Javascript to perform powerful data analysis. In this post, we explore Data Analytics techniques with Javascript, using NPM libraries and the powerful Node.js runtime.


Whether you are digital or not, Data Analytics can and will help optimize your company with intelligent analysis and responses in your data.
In this article, I will not delve into Data Analytics but show that it is possible, simple, fast, and productive to work with Javascript when it comes to data in general.
Portuguese version can be found here.
What is Data Analytics?
Which is something good you may have heard/read, and also that you can help, improve and optimize, but what exactly is it?
Data analysis is a process of inspecting, cleaning, transforming, and modeling data to discover useful information, inform conclusions and support decision-making.
From: https://pt.wikipedia.org/wiki/An%C3%A1lise_de_dados
In short, let's look at the information we have, let's treat it, classify and organize it so that later we can conclude decision-making at a tactical and/or strategic level.
So, a process that a data analyst would do would be something like:
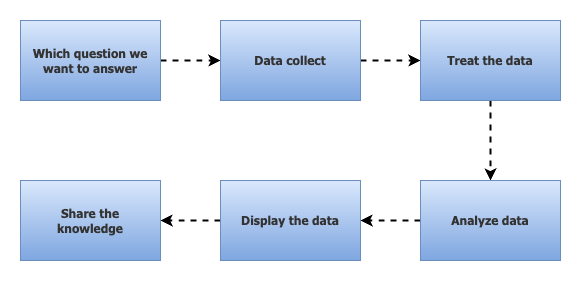
In summary, we have:
- We define which question or problem we are trying to solve.
- Collect the raw data relevant to the problem.
- Treat this data (formatting, relating, removing things that we are not going to use, etc.).
- We analyzed the data.
- Created ways to visualize this data (plot graphs, generate reports, spreadsheets, etc.).
- Share the result.
Analyzing Data with Javascript
As usual, there are several libraries in JS to solve the same problem in different ways, here we are going to look at just one; Tidy.js.
Tidy JS is a library inspired by an R language pack (Tidyverse) with a very clean and simple syntax, prioritizing the readability of your code. The documentation is full of examples and a lot of explanation about each method.
There's no secret to starting a project, if you've already started a Node.js project you'll see that it's more of the same. Just create a package.json file and add the lib with our JS files and we're done.
Let's run two commands in the terminal (start the project and install the lib), first, create a folder on your desktop and navigate to it through the terminal, then run:
npm init -y
npm install @tidyjs/tidy -S
Starting a new Nodejs project and adding tidy dependency.
Now we can open your project in the code editor (Vscode for me):

Let's do a quick modification to the package.json file so that it accepts the ES syntax (No need to worry about this, it's just a design pattern detail, but if you want to know more, search for "Node.js CommonJS vs ES6 "). Just open the file and add the line "type": "module",:

To start with the code, let's create a .js file in the root of our project, the name doesn't matter right now, but I'd suggest something like index.js or main.js. In this file we will put a small example code from the Tidy documentation, just for testing:
import { tidy, mutate, arrange, desc } from "@tidyjs/tidy";

const data = [
    {a: 1, b: 10 },
    {a: 3, b: 12 },
    {a: 2, b: 10 },
];

const results = tidy(
  data,
  mutate({ ab: (d) => d.a * d.b }),
  arrange(desc("ab"))
);

console.table(results);
Example code.
Earlier we talk about the steps to analyze data, we have a very simple form of this happening in this example.
We have the variable data with a collection of data with properties a and b, each with a numerical value and in random order, which would be our raw data. Imagining that the problem here is to order this collection of data based on a third property (ab) which is the result of multiplying a with b.
To run the code run in the terminal: node index.js, the output has the following result:

So here, we have our data analysis with JS (or not), without any headaches, and in a simple and fast way. But what if we try to do something more real-world and with more data?
For a more complex example, I'll use a database from the Kaggle website, a community for data scientists where among other things there are several databases of all types and sizes for you to use in your study projects.
I will use the database containing information about cyclists, and the City Bike Dataset.
Download the Dataset and place it in the same folder as our project:


Let's start our step-by-step that we've talked about before, and to guide us in search of the result I'm going to use the following question: "What time do people most start their bike race?".
Putting together a quick sketch to guide us, what we're going to do is:
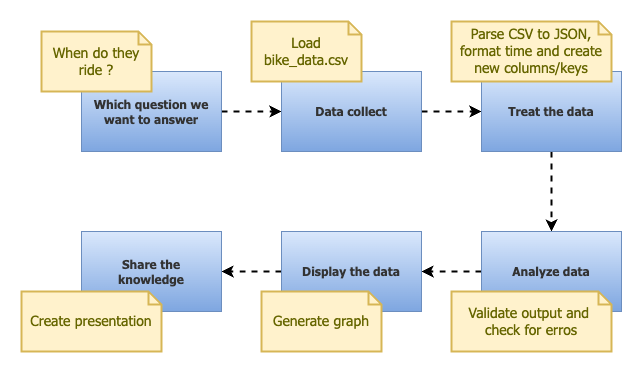
The first two steps are already complete (Define the question and collect the data), let's now proceed to the processing of this data.
Tiddy.js accepts data in JSON format or a JS Array. As we have the data in CSV format we will need to parse this data, for that we will use another library: csvtojson. Just add to the project:
npm install csvtojson moment -SAdding csvtojson and moment to project.
In the index.js file lets import and use the csvtojson:
import csv from "csvtojson";

const data = await csv().fromFile(
    "/Users/user/www/tidyjs/bike_data.csv"
    );
Change the file path.
Now that we have your CSV parsed to JSON the next step is load this data into Tiddy and starting our job:
import { tidy, mutate, count } from "@tidyjs/tidy";
import moment from "moment";
import csv from "csvtojson";

const data = await csv().fromFile(
  "/Users/tuliocalil/projetosJs/nodejs/tidyjs/bike_data.csv"
);

const results = tidy(
  data,
  mutate({ start_hour: (d) => moment(d.starttime).minutes(0).format("LT") }),
  count("start_hour", { name: "count" }),
  arrange(desc("count"))
);

console.table(results);
Importing CSV to Tiddy
Quickly explaining, in the first three lines we have the import of some Tidy functions (tidy, mutate, arrange, desc and count), the import of moment (to work with dates, it is not the ideal library currently, but Tiddy uses moment to extend some functionality) and csvtojson, which as we've seen, parses CSV to JSON.
Right at the end of the code, where we have the declaration of the results variable, we have Tidy coming into action, we are passing the data as the first parameter (our data) and then using the mutate function, which will create a property within the objects of the collection of data, we are creating the start_hour, which will receive the start time of the race as a value, disregarding the minutes, for that we use the moment, zero the minutes and format the date in the "LT" format. using the count function, which counts the distinct values of a given property and registers the value of a new property in the object, in this case, the new property is also called count. data, it is unnecessary later on, but now that we want to see the data before plotting it, we will need it. The output of our console.table will be as follows:

With our data ready, let's now go to a more beautiful visualization of this data, for this, we will add one more lib (actually, two):
npm install chartjs-node-canvas chart.js -SAdding Chartjs lib
With ChartJS added to project, we can modify the code:
import { tidy, mutate, count } from "@tidyjs/tidy";
import moment from "moment";
import csv from "csvtojson";
import { promises as fs } from "fs";
import { ChartJSNodeCanvas } from "chartjs-node-canvas";

const data = await csv().fromFile(
  "/Users/tuliocalil/projetosJs/nodejs/tidyjs/bike_data.csv"
);

const results = tidy(
  data,
  mutate({ start_hour: (d) => moment(d.starttime).minutes(0).format("LT") }),
  count("start_hour", { name: "count" })
);

const configuration = {
  type: "bar",
  data: {
    datasets: [
      {
        label: "Bikes",
        data: results,
        borderColor: "#FFA500",
        backgroundColor: "#FFCD28",
        borderWidth: 2,
      },
    ],
  },
  options: {
    parsing: {
      xAxisKey: "start_hour",
      yAxisKey: "count",
    },
  },
};

const chartJSNodeCanvas = new ChartJSNodeCanvas({
  width: 400,
  height: 400,
});

const buffer = await chartJSNodeCanvas.renderToBuffer(configuration);
await fs.writeFile("./graph.png", buffer, "base64");
Final code
In this code we just remove the ordenation from Tiddy, configure the chart (type, dataset, colors and columns) and generating the image file (png file).
Running this we get:

We finished our data analysis with a very large base and with real data.
As I've been suggesting in a few moments, all the libraries used here have alternative versions and you don't need to stick to one.
Conclusion
I hope it was clear how simple it is to use Javascript (Node.js) for data. Not only think about how comfortable it is to use a language that you are used to for a new challenge but also to take advantage of the entire Node.js ecosystem for this or to discover an alternative to what you already do in another ecosystem.
Node.js is known above all for its performance and that can be applied here as well (including here is a link to a video by the brilliant Erick Wendel about multi-threading) in addition to having a very large community and the package manager's most popular, the NPM.
We can also add the use of Typescript and we will have even more power and productivity during the development and maintenance of our codes, in the example below I created a type (just a few properties) for my Dataset, which allows me to have a great IntelliSense in development time:

I'm not /exactly/ in a data engineer, I recently needed to study a little about the subject and for all the material I found I thought "Hey, JS solves this in a much simpler way", so I decided to write about (out of curiosity it also didn't leave me until I got to the bottom of it). If you think I've missed any point, feel free to comment or if you have any doubts as well.
The project code can be found here.